
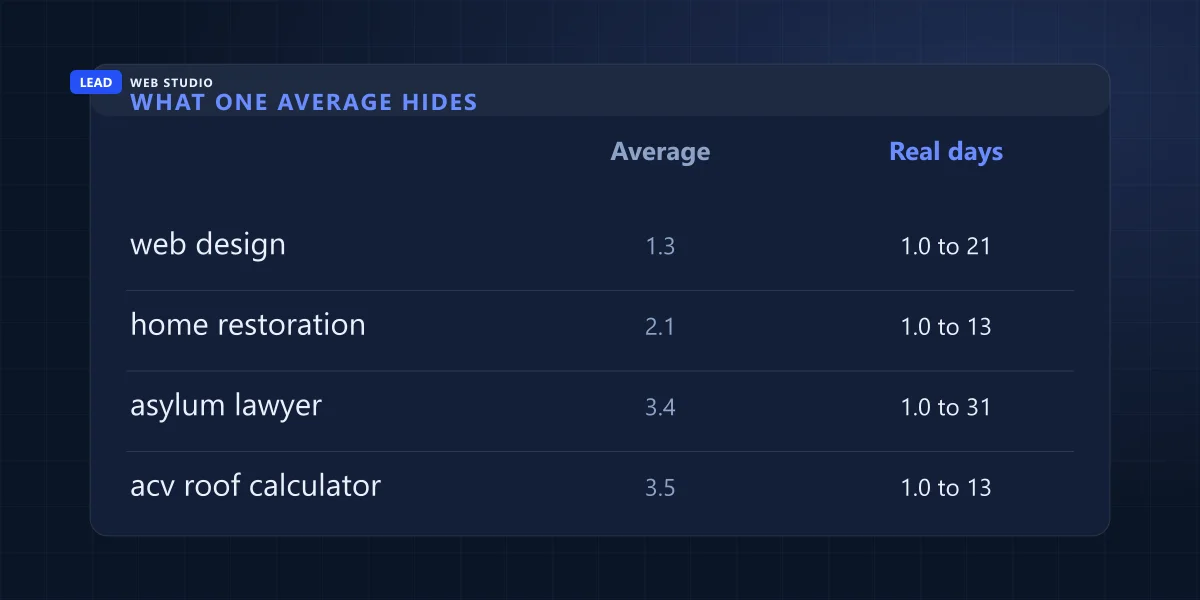
Search Console tells me this website sits at average position 1.3 for "web design". First place, more or less, for the two words I sell. The report is not lying to me — it is answering a different question than the one I thought I was asking. Over 180 days that phrase put me on the results page on fourteen of them. On my best of those days I was first. On my worst I was twenty-first. On the other 166 days I was not on the page at all, and none of that absence is in the 1.3.
I have been reading that column for years and I had never measured how far it sits from what a customer sees. So I did. Nine Google Search Console properties I have read access to — my own site, a roofing and restoration company, a stucco contractor, a paralegal, a notary, an art gallery, a couple more — across the 180 days from 12 March to 8 September 2026. Brand searches and site: operator queries stripped out. That leaves 12,920 distinct searches and 284,287 impressions.
I went in expecting the date range to be the villain. It was not. The two things that actually break the number are far less obvious, and one of them affects a third of every phrase in the dataset.
The short version
- The average covers far fewer days than the range you picked. The median non-brand phrase appeared on 16 of 180 days. Six per cent appeared on exactly one day. Days you did not rank at all are not counted as bad days — they are not counted at all.
- The day-to-day swing behind one average is enormous. On 702 phrases that showed up on 14 days or more, the median middle-80% band was 20 places wide, and the median best-to-worst range was 39 places. Only 3.8% held inside a three-place band.
- The number often is not about one page. Of 1,556 phrases with 30+ impressions, 539 had more than one of the site's pages ranking, with a median gap of 25.5 places between the best and worst of them.
- Search Console will not tell you which part of the results page you appeared in. Eight of my nine properties reported no search-appearance types at all, and the API flatly refuses to break appearance down by phrase.
- The date range, the thing I blamed first, barely matters. 28 days against 180 days on 515 phrases: median difference 2 places.
What does average position actually mean in Search Console?
It is the average rank of the topmost link to your site, counted only on the searches and days where your site appeared at all. Google's own definition is that position 1 is "the topmost position, 2 is the next position, and so on." It is a historical average, not a live ranking, and by default it is not about any single page.
Three phrases in there do all the damage. Average: you are seeing one number instead of a distribution. Topmost link to your site: that may not be the page you have in mind. Only where your site appeared: absence is invisible in this report.
How many days was your phrase even on the page?
Fewer than you think. Taking every non-brand phrase with at least ten impressions and counting the days it appeared at all: the median was 16 days out of 180. Sixteen per cent of phrases appeared on six days or fewer. Only 5.8% appeared on 90 days or more. Your six-month average is usually a two-and-a-half-week average wearing a six-month label.
| Days the phrase appeared, out of 180 | Share of phrases | Impressions |
|---|---|---|
| 1 day only | 6.0% | 20,009 |
| 2–6 days | 10.2% | 22,251 |
| 7–29 days | 56.1% | 32,572 |
| 30–89 days | 21.9% | 39,853 |
| 90 days or more | 5.8% | 45,279 |
This is why searching for yourself so often disagrees with the dashboard. If a phrase put you on the page on 11 scattered days and you ranked well on those 11, the report shows you the average of those 11 days and stops. It says nothing at all about the other 169, because on those days Google recorded no impression to average.
What the average is hiding on the days you did appear
A swing wide enough to make the average close to meaningless on its own. On the 702 phrases stable enough to test — present on 14 days or more, 30 impressions or more — the median middle-80% band was 20 places wide. The median distance from the best day to the worst day was 39 places. Only 27 of those 702 phrases stayed inside three places.
| How wide the middle 80% of days was | Phrases | Share |
|---|---|---|
| Under 3 places | 27 | 3.8% |
| 3 to 9 places | 146 | 20.8% |
| 10 to 24 places | 245 | 34.9% |
| 25 places or more | 284 | 40.5% |
The "web design" row from the opening is one of these. So are three others I can show you side by side: a restoration company averaging 2.1 that ranged from 1st to 13th, a paralegal averaging 3.4 that ranged from 1st to 31st, a roof-calculator search averaging 3.5 that ranged from 1st to 13th. Five of the 28 top-three averages in this set spent their worst tenth of days sitting at position 10 or below — an average that reads like page one, on days that were not page one.
Which of your pages is that number about?
Often several at once, which is why it can match none of them. Of the 1,556 phrases with at least 30 impressions, 539 had more than one page from the same site ranking for them — 34.6%. The median gap between the best-placed and worst-placed of those pages was 25.5 places. One number cannot describe both ends of that.
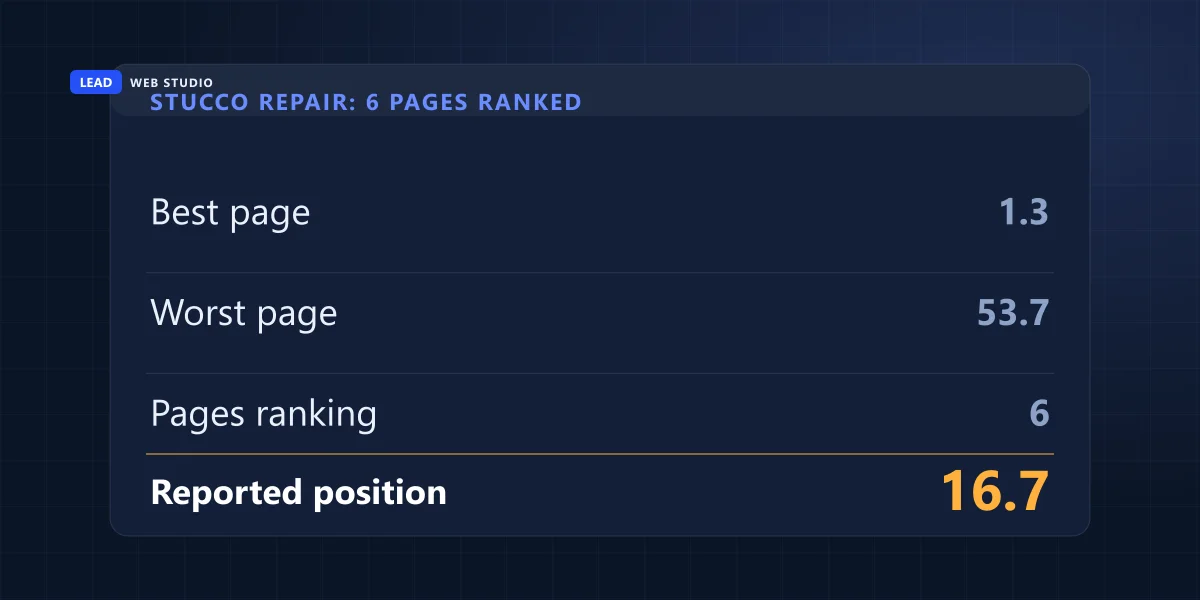
The stucco contractor's site is the clearest case. For "stucco repair" — 2,665 impressions over the window — Search Console reports position 16.7. Six pages of that site ranked for the phrase, the best averaging 1.3 and the worst 53.7. There is no page on that site whose number is 16.7.
| Search phrase | Impressions | Reported position | Pages ranking | Best → worst page |
|---|---|---|---|---|
| stucco repair | 2,665 | 16.7 | 6 | 1.3 → 53.7 |
| stucco wall | 1,337 | 10.3 | 18 | 8.8 → 96.0 |
| what is the underside of a roof overhang called | 1,734 | 3.8 | 3 | 2.6 → 91.7 |
| what is recoverable depreciation on a roof claim | 1,251 | 37.1 | 5 | 12.5 → 93.7 |
The mechanism is in Google's API documentation rather than the dashboard: the data can be aggregated by property or by canonical URL, and if you group or filter by page you cannot aggregate by property. The phrase-level row you are reading is the property view. The page rows are a different calculation over a different grouping, which is why they will not add up to it and are not supposed to.
The fix takes ten seconds: add a page filter before you decide anything. A number describing six pages at once cannot tell you which page to work on — and "we improved the average" is exactly the sentence that ends up on a monthly report from an SEO package without meaning a thing.
Will Search Console tell you which part of the page you appeared in?
No, and this is the honest dead end. Search Console has a search-appearance dimension, but it only reports rich-result features — it does not describe the map pack or the ordinary blue links. Eight of my nine properties reported zero appearance types for the entire window. The ninth reported exactly one type on 67 impressions.
I also tried to break appearance down by phrase, which is what you would actually need. The API refuses, with a single-sentence error: "Cannot group by search appearance dimension together with another dimension." The documentation confirms the design — search appearance is described there as a filter against a specific search result feature, and the list of available values has to be discovered by querying the dimension on its own.
Why this matters more than it sounds. Any explanation of the form "you rank first but the map pack is taking the clicks" is a guess. It may well be right — I think it often is — but this report contains nothing that can confirm it, and neither does any tool built on top of this same export. If somebody hands you that explanation as a finding rather than a hypothesis, ask them which column it came from.
The thing I was wrong about
I started this expecting the date range to be the main culprit — that "your position" is whatever number you get by choosing a flattering window. It mostly is not. On 515 phrases with enough volume in both windows, the median difference between the 28-day figure and the 180-day figure was 2 places, and only 14.4% moved by ten places or more.
So the date picker is the least misleading control in the report. Where it does move, it moves for a reason worth knowing. On the roofing site, "what is included in roof replacement" reads 35.6 over six months and 20.0 over the last 28 days — something is climbing. "Recoverable depreciation roof" reads 33.1 over six months and 51.3 over the last 28 days — something is sliding. Those two are worth opening. The other 441 phrases, which moved by less than ten places, are not.
I am reporting this because it is the opposite of what I set out to write, and because it narrows the advice. The date range is fine. The day count and the page blending are the problems.
Does a better average still mean more visits?
At a distance, yes, but not row by row. Grouped by the average position they report, phrases under 3.5 were clicked far more often than phrases past 10.5 — roughly ten to fifteen times more often. Inside the top few positions the pattern stops being reliable, and the reason is the day-count problem again.
| Average position reported | Phrases | Impressions | Click rate | Median days present |
|---|---|---|---|---|
| 1.0 – 1.9 | 1,335 | 15,949 | 0.66% | 1 |
| 2.0 – 3.4 | 1,981 | 20,573 | 1.09% | 1 |
| 3.5 – 10.4 | 2,284 | 88,809 | 0.30% | 1 |
| 10.5 or worse | 7,320 | 158,956 | 0.06% | 2 |
Look at the last column before anything else. In every single bucket, the median phrase appeared on one day. That is what most of a Search Console query list is: single sightings. A row reading "position 1.0" is far more often one impression on one afternoon than a page that owns a search.
That also explains the odd first row. Phrases averaging 1.0–1.9 clicked worse than phrases averaging 2.0–3.4, which makes no sense as ranking behaviour and perfect sense as sampling: the 1.0 bucket is stuffed with one-off appearances that were never going to be clicked. When I restricted the comparison to phrases present on 14 days or more, the same inversion remained — but there were only 20 and 23 phrases left in those two buckets, which is far too few to conclude anything. I am not going to pretend otherwise. What survives is the wide gap: 0.49% at 3.5–10.4 against 0.08% at 10.5 or worse.
How I read the position column now
Five habits, in the order I use them.
- Filter to one page before you read a position. Without a page filter the number can be a blend of six pages ranging from 1.3 to 53.7, as it is on the stucco site above. This is the change that fixes the most.
- Check the day count before you trust the average. Add the date dimension for that one phrase and count the rows. The median in my data was 16 days out of 180 — below roughly that, treat the average as an anecdote.
- Look at the daily line, not the headline. The number you screenshot is the middle of a band that is typically 20 places wide. If you need an actual rank, search for it in a clean browser and write down the date you did it.
- Compare 28 days against 180 days to spot direction, not level. A phrase reading 35.6 then 20.0 is climbing. A phrase reading 33.1 then 51.3 is sliding. The absolute figures matter less than which way they moved.
- Stop explaining zero clicks with a mechanism you cannot see. The report will not tell you whether the map pack took them. Check the Google Business Profile dashboard separately — I measured that split across five businesses and the listings sent more visits than web search did.
If you have never opened this report at all, start with how to read Google Search Console and come back here — this article is only about one column of it. And if you are being shown a monthly report whose headline achievement is a line like "average position improved from 14.2 to 11.8", that sentence is compatible with nothing at all having changed. Send me the domain and I will look at the export with you on a call; if you are choosing between packages or comparing specialists in your trade, ask them which specific pages sit between position 4 and 15 and what they intend to do about those.
Common questions
What does average position mean in Google Search Console?+
It is the average rank of the topmost link to your site, counted only on the days and searches where your site appeared at all. Google defines position 1 as the topmost position on the results page. It is not a live ranking, and it is not attached to one specific page unless you filter it to one.
Why does Search Console say I rank 2 when I cannot find my site on Google?+
Usually because the average is built from a small number of days. In my measurement the median non-brand phrase appeared on only 16 of 180 days, and 16% appeared on six days or fewer. An average taken over a handful of good days will not match the result you see on an ordinary day.
How much does a ranking actually move day to day?+
A lot. Across 702 phrases that appeared on at least 14 days, the median middle-80% band was 20 places wide and the median best-to-worst range was 39 places. Only 3.8% of those phrases stayed inside a three-place band for the whole window.
Does average position change if I pick a different date range?+
Less than I expected. Comparing the last 28 days against the last 180 days on 515 phrases, the median difference was 2 places, and only 14.4% moved by 10 places or more. The date range is the least misleading part of the number.
Why does my average position not match any of my pages?+
Because more than one of your pages can rank for the same phrase, and the phrase-level figure is aggregated by property rather than by page. Of 1,556 phrases with at least 30 impressions, 539 had more than one page ranking, and the median gap between the best and worst of those pages was 25.5 places.
Can Search Console tell me which part of the results page I appeared in?+
No. The search appearance dimension only reports rich result features. Eight of my nine properties reported no appearance types at all, and the ninth reported one type on 67 impressions. The API also refuses to break appearance down by search phrase, returning an error that says it cannot group by search appearance together with another dimension.
So is average position useless?+
No, but it is a rough band rather than a rank. It still separates good from bad at a distance: phrases averaging under 3.5 clicked far better than phrases averaging past 10.5. Use it to sort pages into buckets, then filter to one page and one phrase before you decide anything.
Sources, read in full on 10 September 2026: Google — what impressions, position and clicks count for the definition of position quoted above, and Google — Search Analytics API reference for the property-versus-page aggregation rule and the search-appearance dimension. Everything numeric here is my own measurement rather than an industry study: Search Console data for nine verified properties covering 12 March to 8 September 2026, pulled read-only on 10 September 2026 — 12,920 non-brand searches and 284,287 impressions. Brand searches were identified per property from that property's own name and excluded, along with site: and inurl: operator queries. Click rates are impression-weighted across each group, never an average of per-search rates. One property accounts for most of the impressions, so treat every figure here as nine small business sites in Canada and the United States over six months, not as a law of search.

10+ years building websites for GTA trades, clinics and service businesses. I have Search Console access to nine of them, which is the only reason I could check how far the number in the position column sits from the search page a customer actually sees. Read my full bio · Get in touch