I opened my own Google Analytics for August and it told me 444 people came to my website. Two hundred of them were a machine in Singapore that stayed for twelve milliseconds. I only know that because I went and checked, which is the entire point of this article. Every small business I work with has this dashboard, most of them glance at it once a month, and almost nobody ever compares it against something that can't be faked. So I did that for one month of my own site, and I'm publishing all of it, including the number that makes me look careless.
The short version
- Check you're in the right property first. My site quietly had two. The older one stopped recording on 8 July and still holds thirteen months of history.
- Your visitor count is inflated. Google says it excludes known bots. It excluded none of my 200 twelve-millisecond sessions.
- Your engagement rate is deflated by the same traffic. Mine read 26%. For real humans in Canada and the US it was 52%.
- Your lead count is measuring something else. Analytics said 11. My server delivered 9 messages. The two lists barely overlap.
- Never reach for a data filter first. Google's own docs say the effect "is permanent" and excluded data "is never processed".
- Analytics is good at shape, bad at totals — which pages get read, which channel brings engaged people, this month against last.
- Fifteen minutes, four screens, once a month. That's the whole job, and it's the last section here.
This is the companion piece to reading your Google Search Console. That tool watches what happens before somebody reaches your site. This one watches what they do once they arrive — and it is the one people quote at each other in meetings, which is exactly why it's worth knowing where it bends.
Am I even looking at the right Analytics property?
Check this before you read a single number. Open Admin, look at Property details, and compare the Measurement ID there against the one in your website's source code. If your site was rebuilt, re-tagged or moved by anyone in the last two years, there is a real chance you have two properties and you're reading the dead one.
I found that on my own account while writing this, which is a humbling way to start an article. There are two properties for leadlls.com. Here is when each of them actually recorded data:
| Property | First data | Last data | What it shows today |
|---|---|---|---|
| The older one | Before June 2025 | 8 July 2026 | Thirteen months of history, then a flat line at zero |
| The live one | 14 July 2026 | Still running | Everything since the site was rebuilt, and nothing before |
Two things fall out of that. There is a five-day hole — 9 to 13 July — where nothing was recorded anywhere, so those five days simply do not exist. And anyone who opens the older property today sees a graph that collapses to zero in July and would reasonably conclude the business had died. Its biggest month was February 2026 at 710 sessions, which is more traffic than the live property has recorded in either of its two months. Compare those two figures without knowing the history and you would tell me my rebuild was a disaster.
Do this now, it takes a minute: in Analytics go to Admin → Property details and note the Measurement ID (it looks like G-XXXXXXXXXX). Then open your website, view source, and search for that same ID. If they don't match, every number you have been reading belongs to a different website — or to a version of yours that no longer exists.
Wrong number one: how many people actually visited
Treat the visitor count as an upper bound. My August dashboard said 444 sessions and 393 users. Of those, 200 sessions came from a single country, every one of them Chrome on desktop, every one of them loading exactly one page, with an average session duration of 0.0125 seconds. That is twelve and a half milliseconds. Nobody reads anything in twelve milliseconds.

Here is the same month by country, straight out of the property, for 1–28 August 2026:
| Where from | Sessions | Avg. session | Engagement rate |
|---|---|---|---|
| Singapore | 200 | 0.01 sec | 0% |
| Canada | 91 | 3 min 1 sec | 65.9% |
| United States | 45 | 1 min 37 sec | 24.4% |
| Netherlands | 19 | 4.9 sec | 63.2% |
| Everywhere else | 89 | — | — |
The Netherlands row is worth a second look, because it shows the machinery working. Those sessions averaged 4.9 seconds and still scored 63.2% engagement — a session qualifies as engaged on two page views alone, with no minimum time. Which is the next number along, and the next section.
The awkward part is that Google says this shouldn't happen. Its own documentation states that "in Google Analytics properties, traffic from known bots and spiders is automatically excluded", identified using "a combination of Google research and the International Spiders and Bots List, maintained by the Interactive Advertising Bureau". That list catches bots that announce themselves. Anything driving a headless Chrome browser out of a data centre does not announce itself, and Google's own help page adds that you cannot see how much traffic the filter removed. So you get a number that has been cleaned by an amount nobody will tell you, and still contains at least 45% junk.
One detail sealed it for me. Two of the pages that traffic "landed on" don't exist. They are old URLs from the previous version of this site, and they return 404 today — I checked both while writing this. They still show up as page views because my 404 page carries the Analytics tag, like almost every 404 page does. So a bot guessing dead URLs generates clean-looking page views on paths that were deleted.
Nobody reads anything in twelve milliseconds. Your dashboard will still call it a visit.
None of this is a scandal, and I'm not suggesting Google is hiding anything. It is a measurement limit, and it only costs you something when somebody makes a decision on the raw total. Where it does real damage is when a business owner sees traffic double, assumes the marketing is working, and renews an invoice on the strength of it.
Wrong number two: your engagement rate, which is worse than you deserve
This is the one that surprised me, because it errs against you rather than in your favour. My headline engagement rate for August was 26.1%, which looks like a site nobody can stand. Filtered to Canada and the United States — the only two countries I sell in — it was 52.2%, with an average session of 2 minutes 33 seconds.
The mechanism is in Google's definition. A session counts as engaged if it "lasts longer than 10 seconds", "has a key event", or "has 2 or more screen or page views". A bot that loads one page and vanishes fails all three tests, so it lands in your denominator as a hard zero. Two hundred hard zeros will flatten any average.
| August 2026 | What the dashboard said | Canada + US only |
|---|---|---|
| Sessions | 444 | 136 |
| Users | 393 | 96 |
| Engagement rate | 26.1% | 52.2% |
| Average session | 1 min 15 sec | 2 min 33 sec |
The channel view has the same problem. My biggest channel by far was Direct at 339 of 444 sessions, with only 13.6% of those sessions engaged — a miserable-looking number attached to the largest block of traffic. Google's definition of Direct is traffic where "Source exactly matches '(direct)' AND Medium is one of ('(not set)', '(none)')", which means Google received no origin information whatsoever. Someone typing your address in gets counted there. So does a tap from a WhatsApp message. So does a bot.
Restrict the same report to Canada and the US and the picture inverts. Organic search — 27 sessions — engaged 81.5% of the time. Referrals engaged 70.4%. Direct dropped to 67 sessions at 32.8%. The smallest channel was doing the most work, and the site-wide average was hiding it. If you are paying for SEO and judging it by the overall engagement line, you are grading it on other people's traffic.
One more honest note about small numbers, because I'd rather say it than be caught by it: nine sessions in August arrived from AI assistants, and the two that came from Canada or the US were both engaged sessions. Two out of two is not a finding. It's two. I mention it because it's the direction things are moving, not because it proves anything yet.
Wrong number three: how many leads you got
Analytics counted 11 leads for me in August. My server delivered 9 messages. Those two numbers are close enough that you would assume they describe the same events. They do not. This is the number worth the most money and the one people check the least carefully.
Every conversion event fires because a page loaded, not because a human did business with you. So the first question is always which page. On my property the 11 events split like this:
| Where the "lead" fired | Count | What it really was |
|---|---|---|
| My free audit tool page | 6 | Somebody ran a free tool. No name, no email, no enquiry. |
| The thank-you page | 5 | Closer to a real message, but see below. |
| Analytics total | 11 | What a monthly report would have shown you |
Six of my eleven "leads" were people running the free website audit. That is a useful signal — it means the tool gets used — but it is not an enquiry, and it should not be sitting in the same bucket as somebody asking me to quote a website. That is my tag, on my site, firing on a page load. I found it while writing this article and I have deliberately left it alone rather than quietly fixing it first, because the whole argument here is that you should go and look at your own.
Now the other side. My contact form writes every attempt and its outcome to a log on the server, which is the closest thing I have to ground truth. Same 28 days:
| What the server saw | Count |
|---|---|
| Submissions blocked by the captcha | 179 |
| Messages actually delivered | 9 |
| — of those, my own tests | 2 |
| — of those, agencies cold-pitching me their services | 3 |
| Left over as possible real enquiries | 4 |
Four. Two of those four came with local Canadian phone numbers and read like genuine enquiries. So the honest range for the month is somewhere between two and four real conversations, against a dashboard reading of eleven. And notice that Analytics recorded only 7 form_submit events while 9 messages genuinely arrived — it undercounted the real submissions at the same time as it overcounted the leads. Both directions, same report.
The 179 blocked attempts never appear in Analytics at all, because bots that post directly to a form handler don't run JavaScript and never load the tag. If you have ever been told your form has a terrible abandonment rate, that is the calculation being done on the wrong denominator. I wrote up the full version of that problem in how to capture leads on your website.
So what is Google Analytics genuinely good for?
Quite a lot, as long as you read it for shape instead of totals. Relative movement survives the noise, because the junk is roughly constant month to month. Which pages people actually read is reliable. Which channel brings engaged visitors is reliable once you filter to your own market. Absolute counts of humans and enquiries are not.
Concretely, these are the things I trust it for on my own site and on client sites:
- Page popularity. My homepage took 181 of 694 page views in August and the projects page was second. That ranking is useful and doesn't care about bots.
- Direction of travel. Is this month up or down against last, on the same measurement? Fine, as long as the property didn't change underneath you.
- Which channel deserves the money. Filtered to your country, engagement rate by channel is the most decision-useful screen in the whole product.
- Device split. If most of your traffic is on phones and your site is awkward on a phone, that is a web design problem you can act on this week.
How do I strip the junk out without wrecking my data?
Use a saved comparison rather than a data filter. Google Analytics offers exactly three data filter types — developer traffic, internal traffic by IP address, and web hostname traffic — and none of them is geographic. More importantly they are destructive: Google's documentation says "once you apply a data filter, the effect on the data is permanent" and excluded data "is never processed and will never be available in Google Analytics or BigQuery".
A saved comparison does the same job to your view and deletes nothing. On my property I keep one called Canada + US only, defined as Country exactly matches Canada OR United States. Apply it from the chip row at the top of any report and remove the All Users chip to see the filtered numbers alone. It does not stay applied when you switch reports, which is annoying, and it is still the right tool — a permanent filter applied on a bad afternoon cannot be undone.
The fifteen-minute monthly audit
This is the whole routine. Once a month, four screens, in this order. If nothing has moved, close the tab — that is a legitimate result and not a reason to go looking for work.
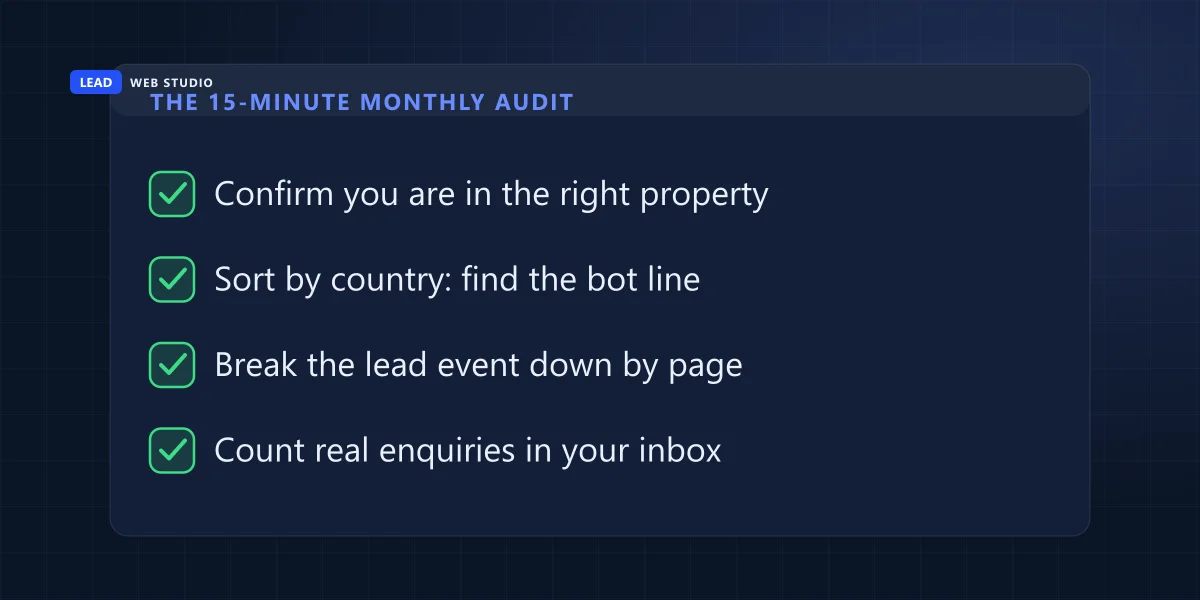
- Admin → Property details. Confirm the Measurement ID matches the one in your website's source. Do this first, once, and never think about it again.
- Reports → Demographics → Country. Sort by sessions. If a country you don't sell to is at the top, that is your bot line, and every site-wide average below it is affected.
- Apply the country comparison, then read Traffic acquisition. Look at engagement rate by channel, not at session counts. That tells you where the useful people come from.
- Reports → Engagement → Events. Find your conversion event, break it down by page path, and ask what actually had to happen for it to fire. If the answer is "a page loaded", then that is what the number counts, and it is not enquiries.
- Then open your inbox. Count the real enquiries for the same dates. That number, not the dashboard, is the one your business runs on.
Step five is the one everybody skips, and it is the only one that can prove the other four wrong. If your Google Business Profile is where most of your enquiries actually start, a lot of your real activity never touches the website at all and will never appear in any of this.
Frequently asked questions
Does Google Analytics count bots?+
It filters some and misses others. Google states that "traffic from known bots and spiders is automatically excluded", using its own research plus "the International Spiders and Bots List, maintained by the Interactive Advertising Bureau". That only covers bots that identify themselves. In August my property recorded 200 sessions from Singapore — all Chrome on desktop, all a single page view, average duration 0.0125 seconds — and Google counted every one. You also can't see how much it filtered out.
Why is my engagement rate so low?+
Usually because automated traffic is dragging it down. Google counts a session as engaged if it "lasts longer than 10 seconds", "has a key event", or "has 2 or more screen or page views". A bot loading one page fails all three and scores zero. My site read 26.1% across everything and 52.2% for Canada and the US alone. The bad number was the wrong one — which is worth knowing before you rebuild a site that was working.
Why does Analytics show more leads than I received?+
Because the event fires on a page load, not on proof that a message arrived. I recorded 11 lead events in 28 days while my server delivered 9 messages, and six of the 11 fired on a free tool rather than an enquiry form. Break your conversion event down by page path and ask what had to happen for it to fire. Then count the real messages in your inbox for the same dates.
Can I exclude a country from Google Analytics?+
No. GA4 has three data filter types — developer traffic, internal traffic by IP, and web hostname traffic — and none is geographic. They are also destructive: "once you apply a data filter, the effect on the data is permanent", and excluded data "is never processed and will never be available". Use a saved comparison instead. It changes what you see and deletes nothing.
What is Direct traffic, really?+
Traffic that arrived with no origin information. Google's rule is "Source exactly matches '(direct)' AND Medium is one of ('(not set)', '(none)')". Typing your address in lands there, so does a tap from a messaging app, and so does anything automated. Mine was 339 of 444 sessions at 13.6% engagement in August — and once I filtered to Canada and the US it fell to 67 sessions at 32.8%.
Should a small business bother with Analytics at all?+
Yes, but read it for shape, not totals. It's reliable on which pages get read, which channel brings engaged people, and whether this month moved against last. It's unreliable as a count of humans or enquiries. Pair it with Search Console for what happens before the click, and with your own inbox for what actually arrived.
Sources, all quoted above: Google Analytics Help on bot traffic exclusion, on engaged sessions and engagement rate, on data filters, and on default channel groups. All site figures are from my own leadlls.com property for 1–28 August 2026, pulled on 30 August 2026, cross-checked against my server's contact-form log for the same dates. No visitor names, addresses or phone numbers appear anywhere in this article.
Not sure whether your numbers are real?
Send me a screenshot of your Analytics home screen and tell me roughly how many enquiries you actually got last month. I'll tell you where the gap is — including "your numbers look fine" if that's the answer. Free, no pitch. If the site underneath turns out to be the problem, that's web design work and the pricing page says what it costs. Keeping the tracking honest is part of ongoing website maintenance and support.
Get My Free Quote
10+ years building websites and looking after Analytics, Search Console and Google Business Profiles for GTA trades, clinics and service businesses — which is why I check every dashboard number against something that can't be faked. Read my full bio · Get in touch